
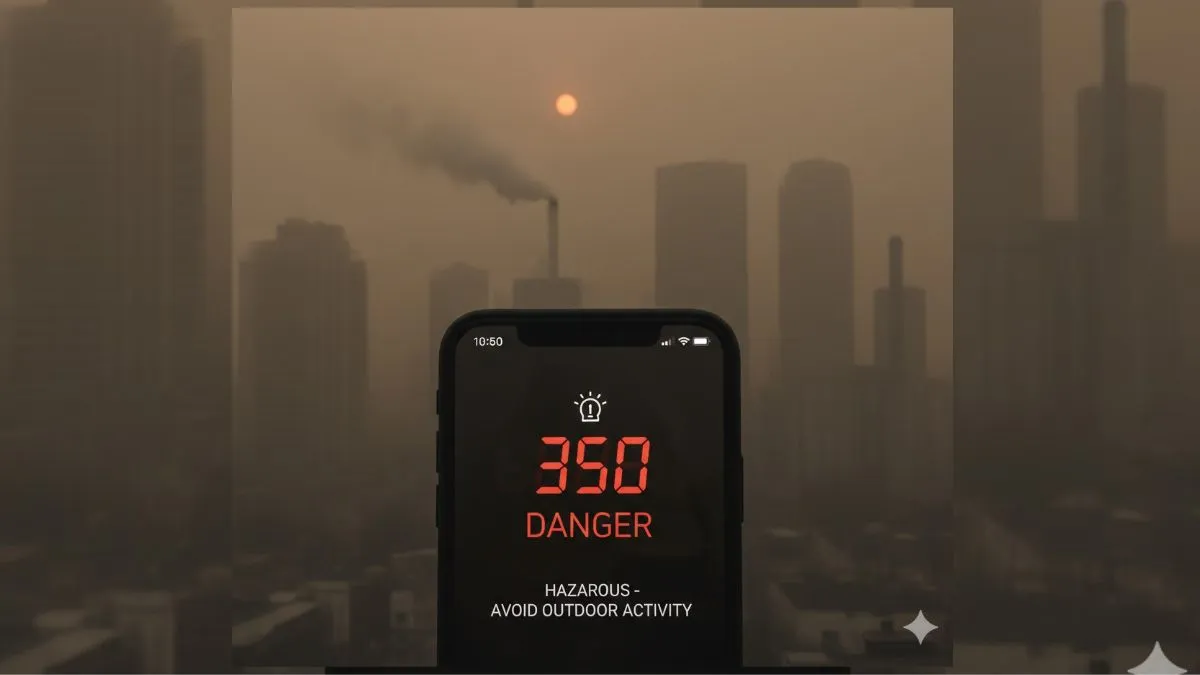
As the pollution levels spike across Delhi and several Indian cities, Google Maps has come up with a real-time AQI tracker, which will help the users to remain updated with their surroundings when it comes to air quality. An update on the platform includes hourly pollution updates from more than 40 countries worldwide, of which India is one.
Earlier, AQI readings appeared delayed on Google Maps, but now, with the latest update, users will be able to see live air quality in their area before heading out for commuting, a workout session, or travel plans. That said, the update would make it really easy for users to schedule outdoor activities while keeping in mind the accurate data on pollution.
Colour-coded AQI display for easy reading
To make AQI data easily understandable, Google Maps uses a colour-coded scale. Readings get updated on an hourly basis and will be shown on both desktop and mobile versions of the application.
The AQI scale runs from 0 to 500, with lower numbers indicating cleaner air.
- 0–50 : Good (Green)
- 51–100 : Satisfactory (Yellow)
- 101–200 : Moderate (Orange)
- 201–300 : Poor (Red)
- 301–400 : Very Poor (Purple)
- 401–500 : Critical (Maroon)
These colours help users gauge quickly whether it is a good time to step outside or whether they should avoid outdoor exposure.
How to check AQI on Google Maps
- Step 1: Update the Google Maps app on Android or iOS to the latest version.
- Step 2: Launch the application and provide your city, region, or current location in the search bar.
- Step 3: Tap the layers icon (stacked squares) on the right side of the map.
- Step 4: Among the options, select 'Air Quality'.
- Step 5: Tap any shaded area on the map to view the AQI score and information.
It enables users, through this real-time AQI feature, to make informed choices concerning their health, particularly in high pollution seasons.