Air-pollution levels in Delhi rose 50% during the first week (January 1 to 7, 2016) of the state government's odd-even measure over the previous week (December 25 to December 31, 2015), according to an analysis of PM (particulate matter) 2.5 data, generated by IndiaSpend's #Breathe air-quality monitoring devices.
The increase in PM2.5 level indicates the need to understand deeper the impact of policy changes, such as the odd-even measure, on Delhi's air.
Additional factors, such as temperature, wind-speed and increased moisture, could account for the rise in air-pollution levels. It is likely, though, that the odd-even measure introduced by Delhi's Government might not, in itself, be adequate.
IndiaSpend earlier reported how additional measures were needed to clean the air of the world's most polluted city. These could include the closure or upgrade of obsolete power plants, restricting trucks (as the Supreme Court has ordered) and two-wheelers and suppressing construction and road dust.
IndiaSpend's analysis is based on weekly average data recorded by six #Breathe devices across Delhi at Sarvodaya Enclave, India Habitat Centre, Munirka, Nizamuddin East, Connaught Place and Chanakyapuri.
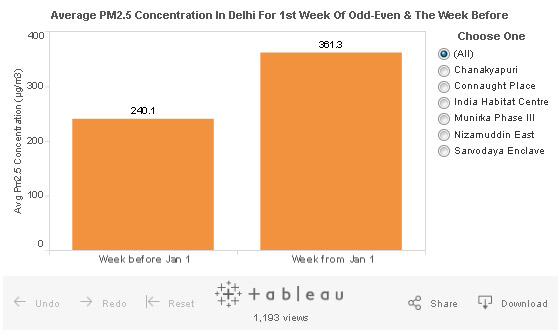
Average PM 2.5 concentration in Delhi's air was 361.3 micrograms per cubic metre (g/m) during week 2 (from January 1 to January 7, 2016, after the introduction of the odd-even measure) giving it a 'severe' rating, according to the guidelines of the Central Pollution Control Bureau (CPCB).
This kind of air can affect healthy people and seriously impact those with existing diseases.
PM 2.5 concentration in Delhi's air was much lower at 240.1 g/m during week 1 (December 25 to December 31, 2015), prior to the introduction of odd-even rule.
PM 2.5 are fine particulate matter found in the air with a diameter of 2.5 micrometres or less and are known to pose the greatest risk to human beings.
Their measurement is considered to be the best indicator of the health risks from air pollution, according to the World Health Organization (WHO).
On average, daily PM 2.5 concentration levels have been above 250 g/m on every day of week 2, attaining a 'severe' rating.
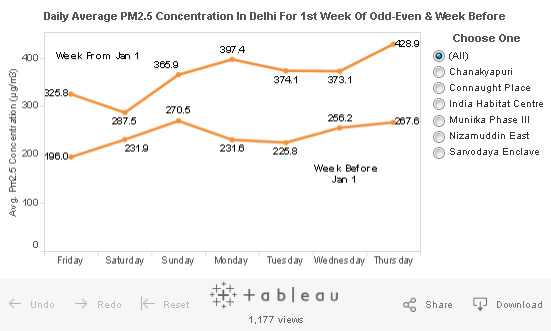
Week 1 witnessed average daily PM 2.5 concentration reaching 'severe' levels on three days, with 'very poor' air quality (151 to 250 g/m) over the other four days. This could lead to respiratory illness on prolonged exposure.
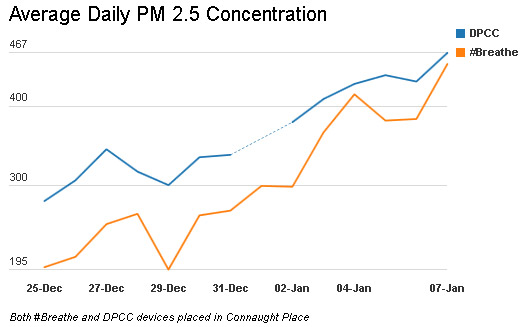
The increase in average PM 2.5 concentration levels from week 1 to week 2 has also been visible in data released by sensors of the Delhi Pollution Control Committee (DPCC) and System of Air Quality and Weather Forecasting And Research (SAFAR), an advocacy.
To illustrate this, we compared average daily PM 2.5 concentration data generated by our #Breathe sensor at Connaught Place with one installed by the DPCC in the same vicinity.
PM 10 (particles between 2.5 to 10 m in diameter) during week 2 recorded 'severe' ratings for seven days, and 'very poor' for one day.
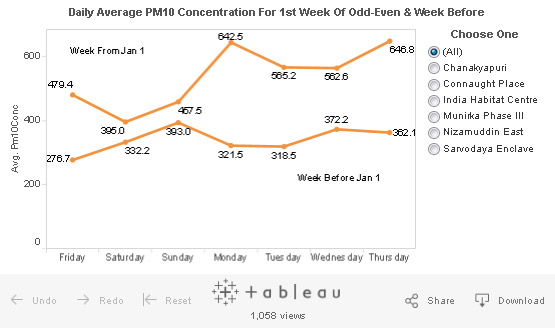
Week 1 did not record any day with 'severe' rating. Instead, our sensors recorded 'very poor' air quality over three days and 'poor' (PM 2.5 concentration between 91 to 150 g/m) over four days. A 'poor' rating implies breathing discomfort to most people on prolonged exposure.
How did the odd-even measure work during morning and evening rush hours?
The hourly average PM 2.5 level between 9 am and 10 am, recorded by our sensor at Chanakyapuri for Monday, week 1, was 283 g/m. For Monday, week 2, after the enforcement of the odd-even rule, PM 2.5 levels rose 60% to 450 g/m.
The hourly average of PM 2.5 levels between 6 pm and 7 pm doubled from week 1 to week 2.
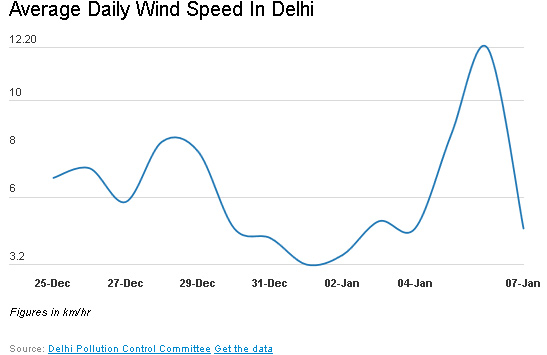
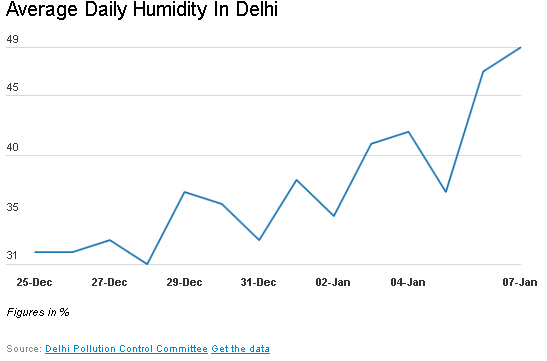
As we said, additional factors, such as temperature, wind-speed and increased moisture, could account for the rise in air-pollution levels.
The graphs below show how wind-speed and humidity varied over the period under consideration.
(Indiaspend.org is a data-driven, public-interest journalism non-profit).